Introduction
This guide will show you how to configure and use the XC Aggregate Teams report and show you how to display this report in a Panel. Please note that for this report to be usable for Cross Country scoring, each Cross Country team member must belong to an Aggregate Type team. For more on configuring your event for Teams, click HERE.
In most cases, you will have to manually add the XC Aggregate Teams report to your event.
- On the Reports tab of your CT Live event, click the +Add Report button.

- Search 'XCA', and you will see the report appear as "Standard/XcAggregateTeams". Select the Report, and a title, and click Continue.

- On step 2, specify the Race, Interval, and Reg Brackets you would like the report to draw results from.

- Under the Calculate heading, choose a Time Type - Gun Time or Chip Time - and then Specify the Number of Athletes to Calculate in the report's results.
- Under the Rank Teams heading, set the number of Required Finishers to Rank a team in the report, then set the number of Pushers that each team is allowed.
- Under the Show header, choose whether the report will show Team Awards, Team Details, or Athlete Details.
Team Awards is a simple, consolidated view.

Team Details shows more fields with only team names and allows the XC report to be used in a Panel (see details below).

Athlete Details shows the most information with all athlete names listed.

- Under the Options header, if you selected either the Team Details or Athlete Details options, you can also choose to Hide Ineligibles (teams that did not meet the criteria defined above).
- If you selected the Team Details option, you can choose to Hide Team Member Names.
- Lastly, determine whether the report will display Confirmed, Disqualified, Withdrawn, or Did Not Finish entries, or all four.

- When finished with the above settings, click Complete & Save
Using the Report
Once you've added the report, it will appear under the Custom heading at the bottom of the Reports page.

As athletes belonging to team finish the race, the report will begin to populate with data. See the previews under step 7 above to see how these will appear.
You can use the Print button at the top of the page to open the report in PDF form and launch your browser's printing dialogue.

How Are XC Results Calculated?
The XC report calculates based on a combination of the "Number of Athletes to Calculate" and "Required Finishers to Rank" settings in the report.
In the case of ties, we use the NFHS rules:
National Federation Rule Book, Rule 9, Section 2, Articles 4-5:
"9-2-4. Ties in team scoring shall be resolved by comparing the sixth-place finishers from tying
teams. The team with the best sixth-place finisher shall prevail. If one team does not have a sixth place finisher, the team with the sixth-place finisher shall prevail.
9-2-5. If only five competitors of tying teams finish, the tie shall be resolved by totaling the scores
of the first four finishers."
Using the XC Aggregate Teams Report in Panels (Scrolling Results)
If you intend to use your XC Aggregate Teams report in a Panel, it's best to set the Report up before you make the Panel, but you can add a new XC report during the Panel creation process.
- To make a new Panel, click the Create New Panel link on the Event Dashboard.

- In the new tab that opens, add a Title and Subtitle (optional) and click Continue.

- On the next step, select the Report option and either select an existing XC Aggregate Teams report from the dropdown, or use the Add Report button to launch the Add Report dialogue and use the process described Above to configure the new report.

If you previously added an XC report to your event and you don't see it listed in the dropdown, go back to your event's Reports tab and edit the XC Report to ensure you selected the Team Details option under the "Show" header. - Once you've selected the report, click Continue.
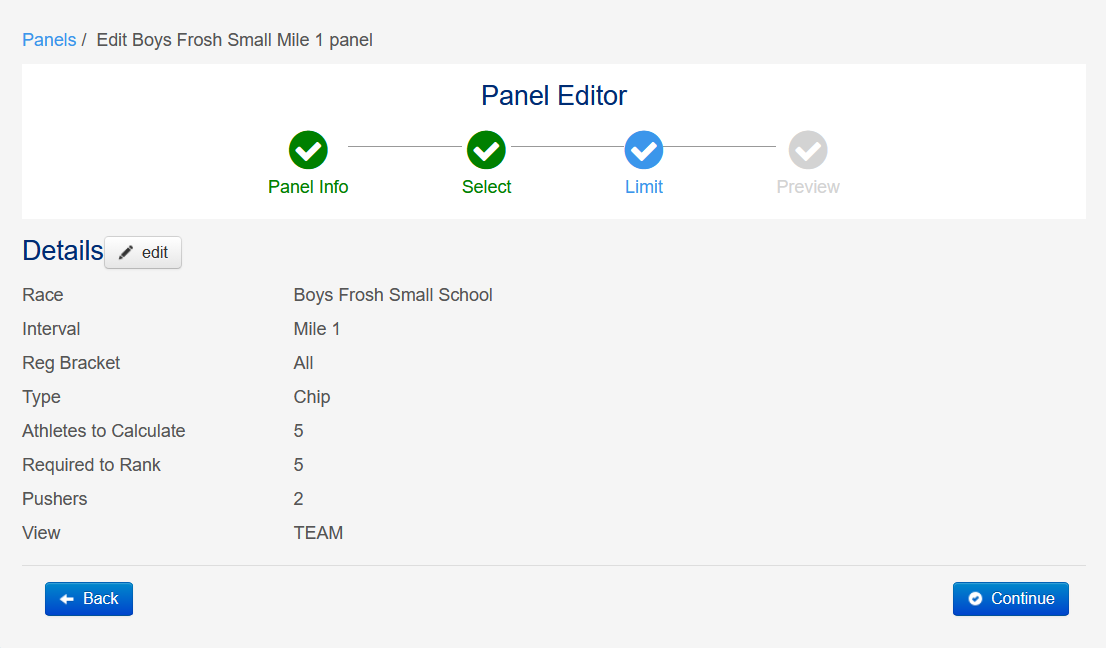
- On the next step, you'll see a summary of the settings configured for the report. If you're satisfied with the settings, click Continue. If you want to change any of the report settings, click the edit button to launch the Edit Report window and make adjustments.

- On the final step, you can configure how the Panel is displayed. The Display Method for the Panel. Scroll will push a single result off the screen at the interval selected on the Speed slider. Slide Show will display the Panel's athlete capacity for the specified interval, then show the next x number of athletes.
- On the next step, you can customize the Display Method between Scroll or Slide Show, scroll speed, and Font, text, and background display options. Always test the panel in multiple lighting conditions to verify that the selected colors will be easily visible to athletes.

- Finally, you can choose to hide the Title and Icon to help conserve space in the Panel. You can also choose to Center Columns.
- Click Save & Publish to complete the process. Panels can be edited later if necessary.
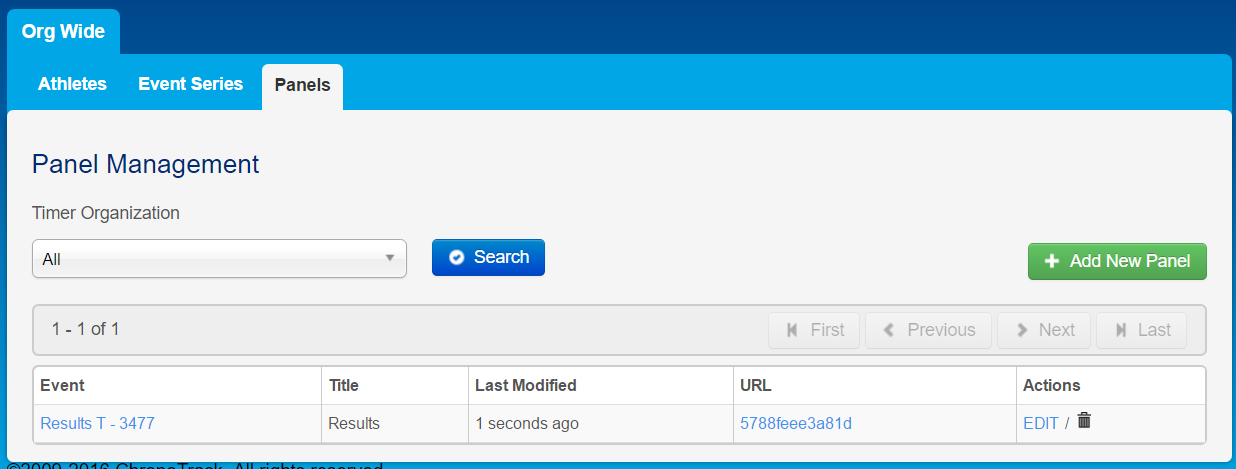
- You will be directed to the Panels tab of the My Orgs page and your new Panel will be displayed at the top of the Panels list. You can view its title, the last time it was modified, and the URL for the panel. You can click the EDIT link to change any of the Panel's settings or click the trash can icon to delete the Panel. Click the URL to open the Panel.

Using a Panel
To display a Panel, you will need to open the Panel's URL in Chrome or FireFox. For the best experience, put the browser window in Full Screen Mode (F11 for Chrome or FireFox). If you're using multiple displays with multiple Panels, you can use two different computers or a single computer with multiple display ports. You can also use multiple ChromeCast devices and cast wirelessly from separate browser windows from the same PC.
Be aware that ChromeCasts use WiFi to communicate. Make sure that the network you are using to cast the Panels uses a device that is ensured a strong, steady connection.
To make the best use of space, we recommend turning the TV/Monitor you will be using to display the Panel sideways into "portrait" mode. In Windows, you can press Ctrl + Alt + Left Arrow/Right Arrow to orient the screen either left or right to take advantage of a portrait orientation.

As your race progresses, the Panel will start to show XC results only after the number of Required Finishers defined in the report settings has been met.
If you have different races or different categories you want to show, you can set up multiple panels set to display each race/category. Panels can also be edited during the race and will automatically display any changes after they've been saved without refreshing the page.